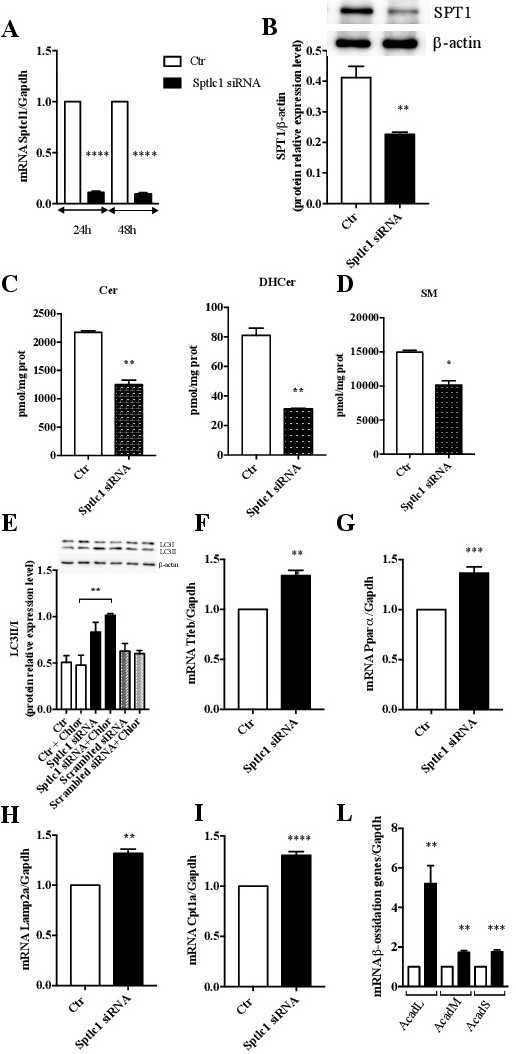
Fig. 6. Transient silencing of Sptlc1 expression recapitulates Myr effects in CF cells. A) Quantification of the expression of the gene encoding for Sptlc1 was obtained by qRT-PCR in CF cells treated with Sptlc1-directed siRNA for 24 and 48 hours. All data are normalized on the housekeeping gene GAPDH and expressed as mean±SE (* p<0.05; ** p<0.01; *** p<0.001); two‐tailed unpaired Student's T‐test. B). Detection of SPT1 protein expression by western blotting in cells treated with Sptlc1-directed siRNA for 24 hours. LCMS quantification of Ceramides (C) and Sphingomyelins (D) in cells treated with Sptlc1-directed siRNA for 48 hours. E) Detection of LC3 I and II protein expression by western blot, in absence or in presence of 1 hour treatment with chloroquine. Quantification of LC3II/I ratio obtained from triplicate samples of Sptlc1-siRNA or Scrambled-siRNa or vehicle was normalized onto β Actin and represented in the bars graph. Quantification by qRT-PCR of the expression of genes encoding for transcriptional factors activated by TFEB after 24 hours of Sptlc1 directed siRNA: F), TFEB; G), Ppar-a; quantification by qRT-PCR of the expression of genes encoding for TFEB- induced genes after 24 hours of Sptlc1 directed siRNA: H) Lamp2a; I) Cpt1a; L) AcadL, AcadM, AcadS. All data are normalized on the housekeeping gene GAPDH and expressed as mean±SE (* p<0.05; ** p<0.01; *** p<0.001); Anova followed by Bonferroni post-test for Fig. L and two‐tailed unpaired Student's T‐test for the other Figures.